The Concept: Riding the Green (and Red) Lines
Launched as a solo passion project and shared natively with the internet on platforms like Reddit, Dietrich disarmingly marketed StonkRider as a “dumb little browser game.” But beneath its goofy premise lies a surprisingly addictive mechanical loop.
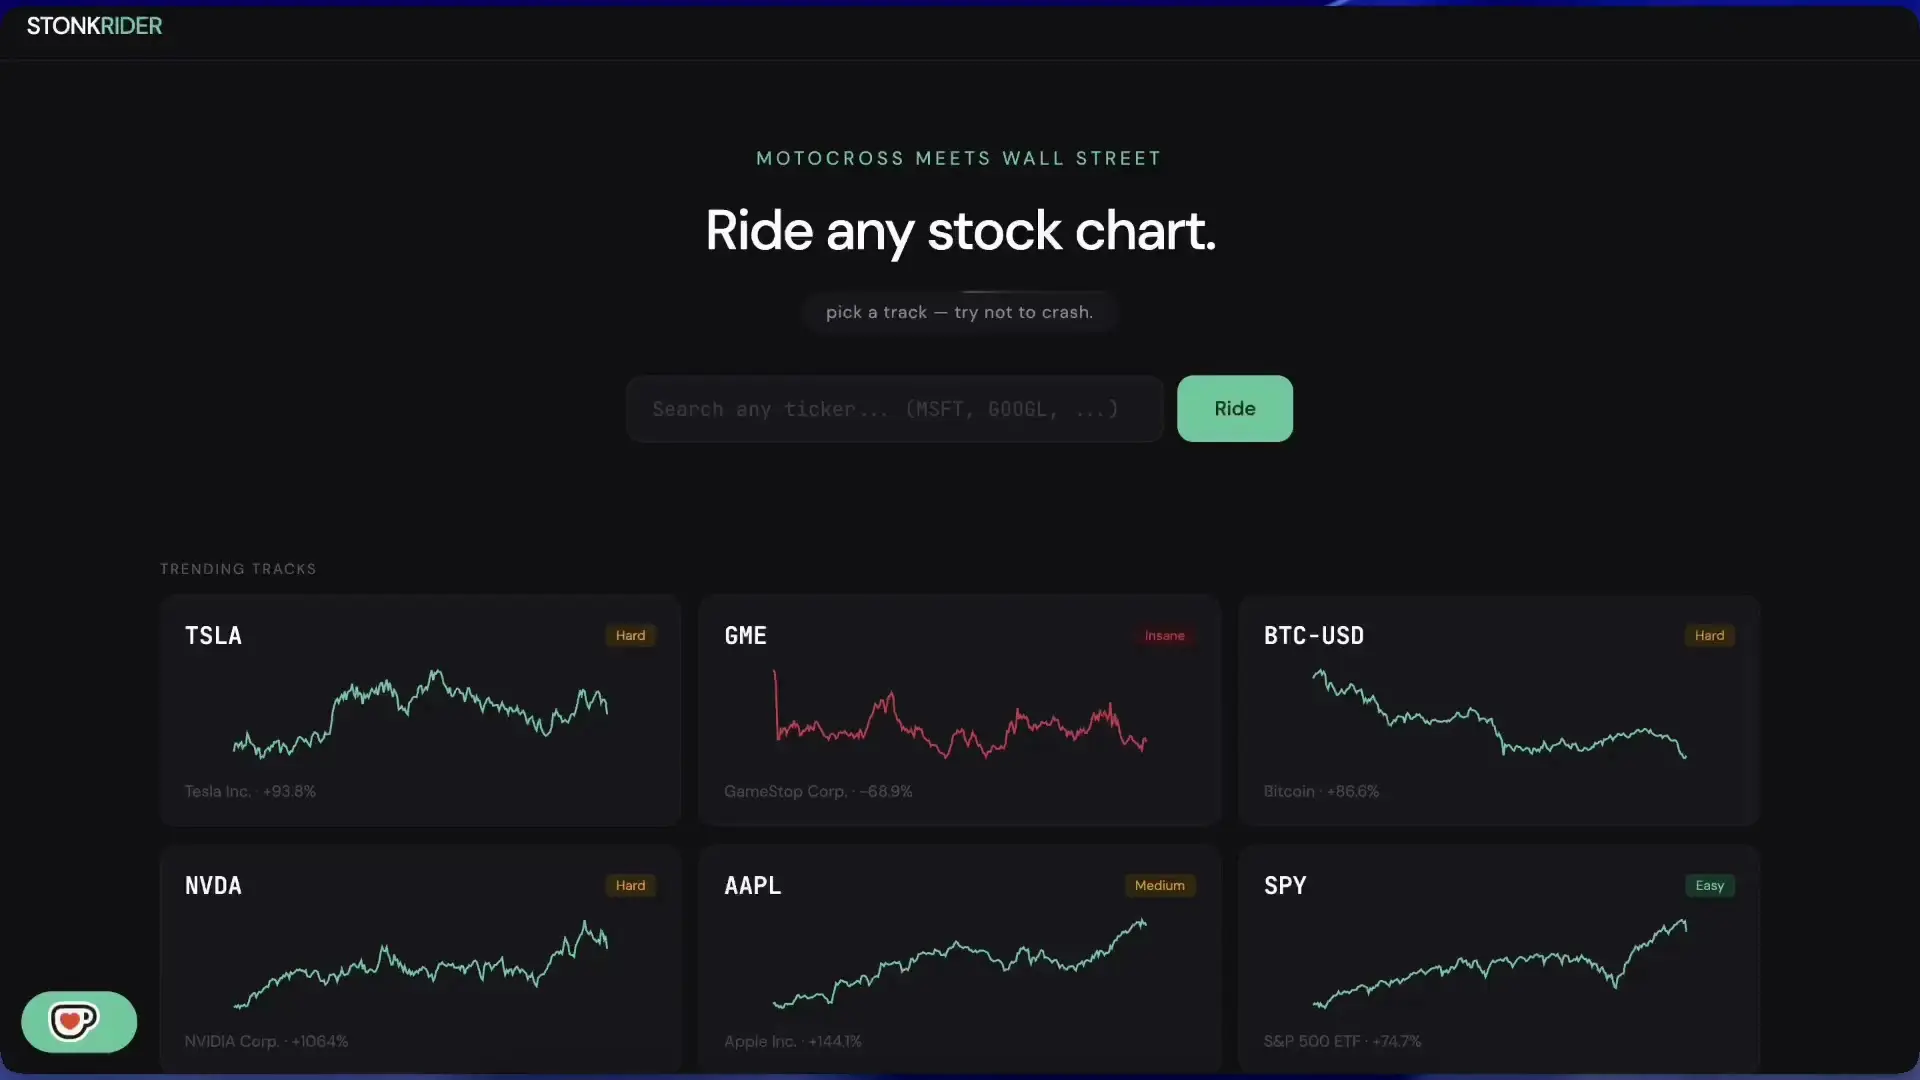
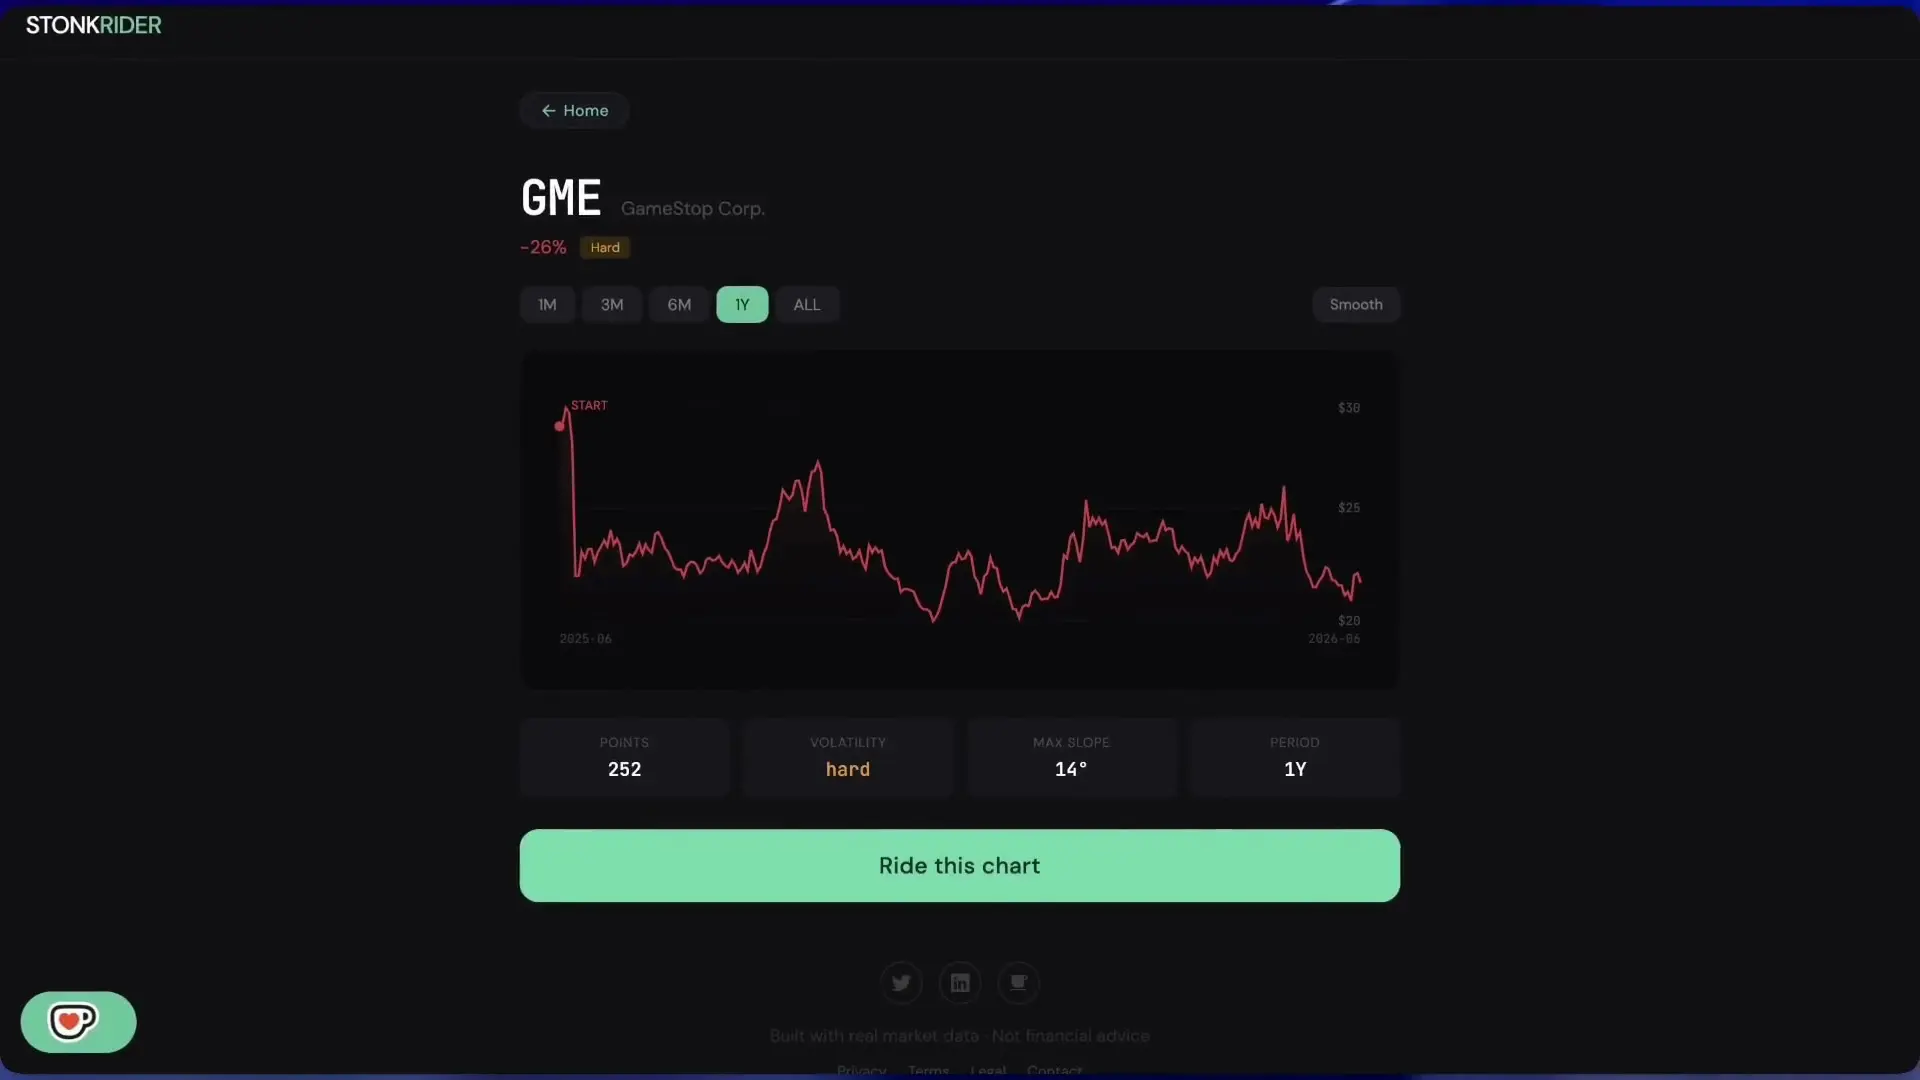
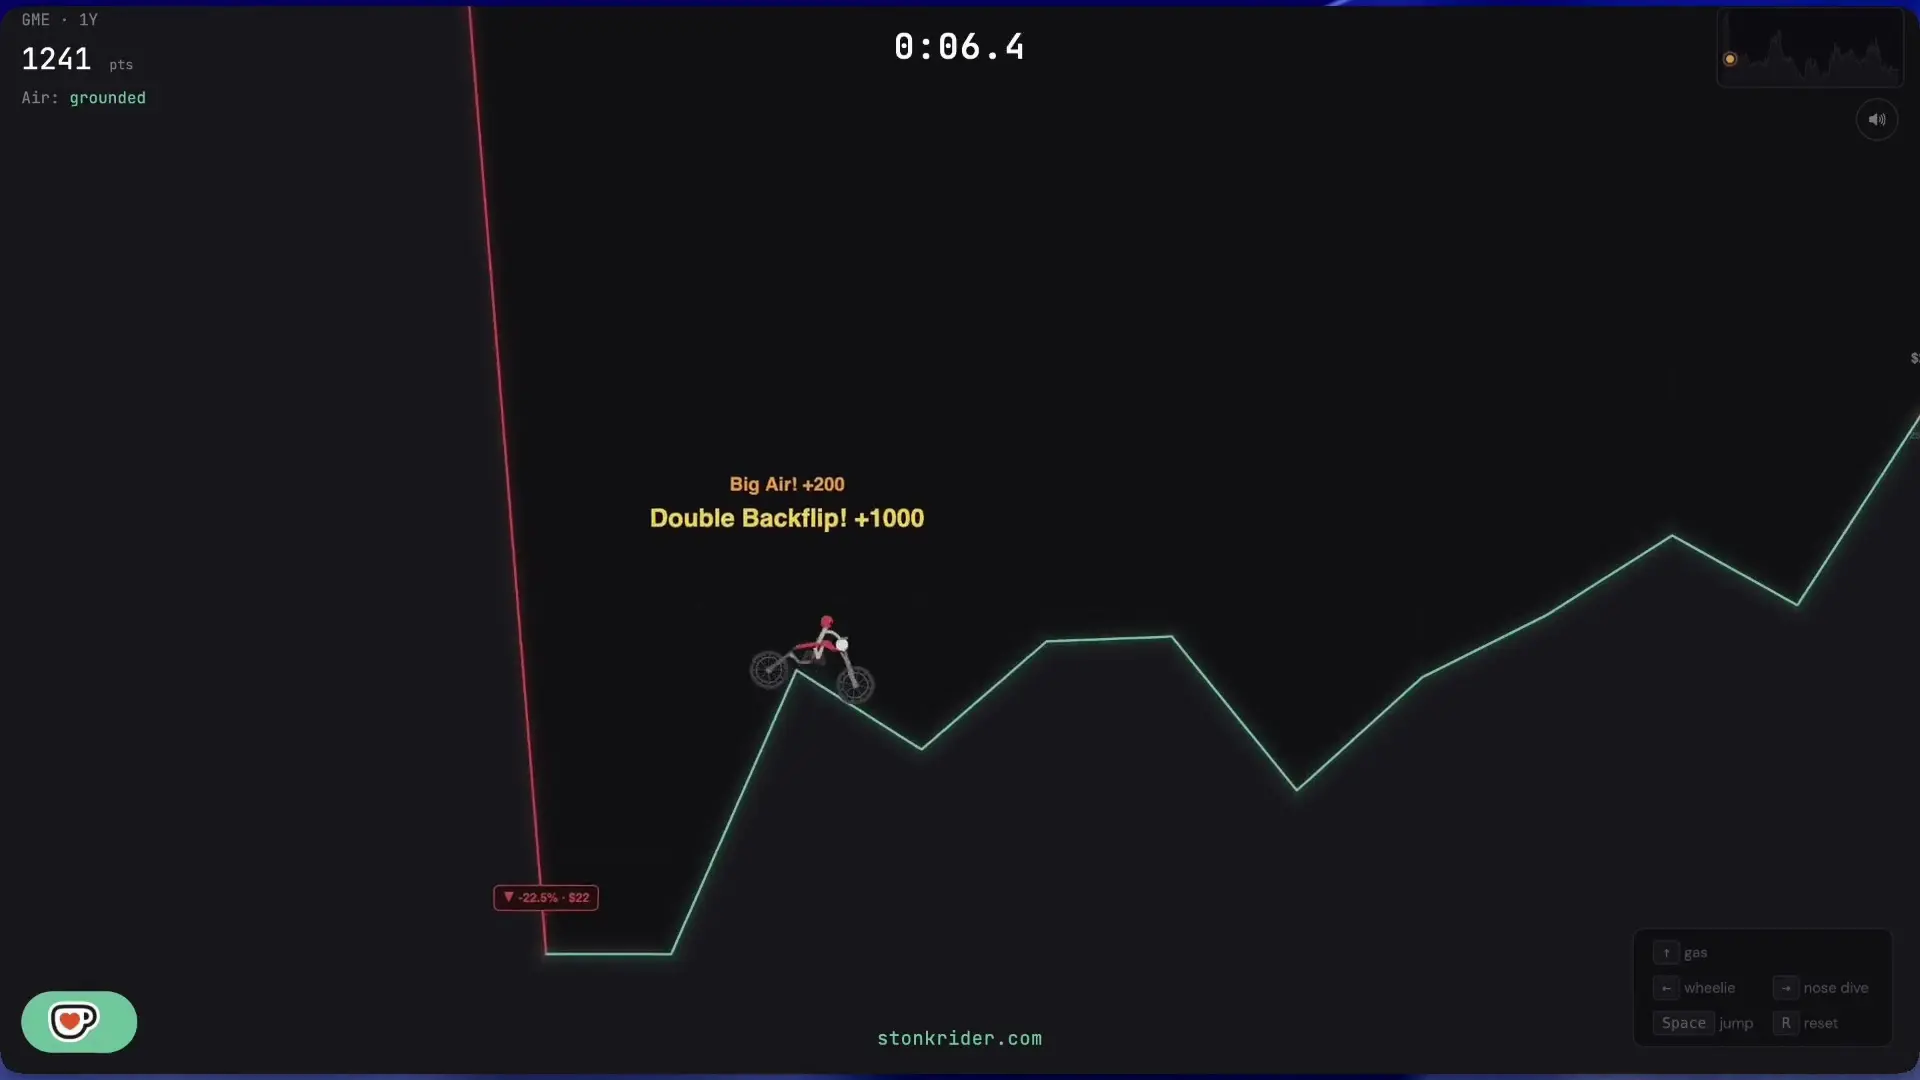
Instead of generating random hills and valleys like a classic side-scroller, StonkRider pulls real, historical stock market charts and maps your physics-based dirt bike directly onto the trend lines.
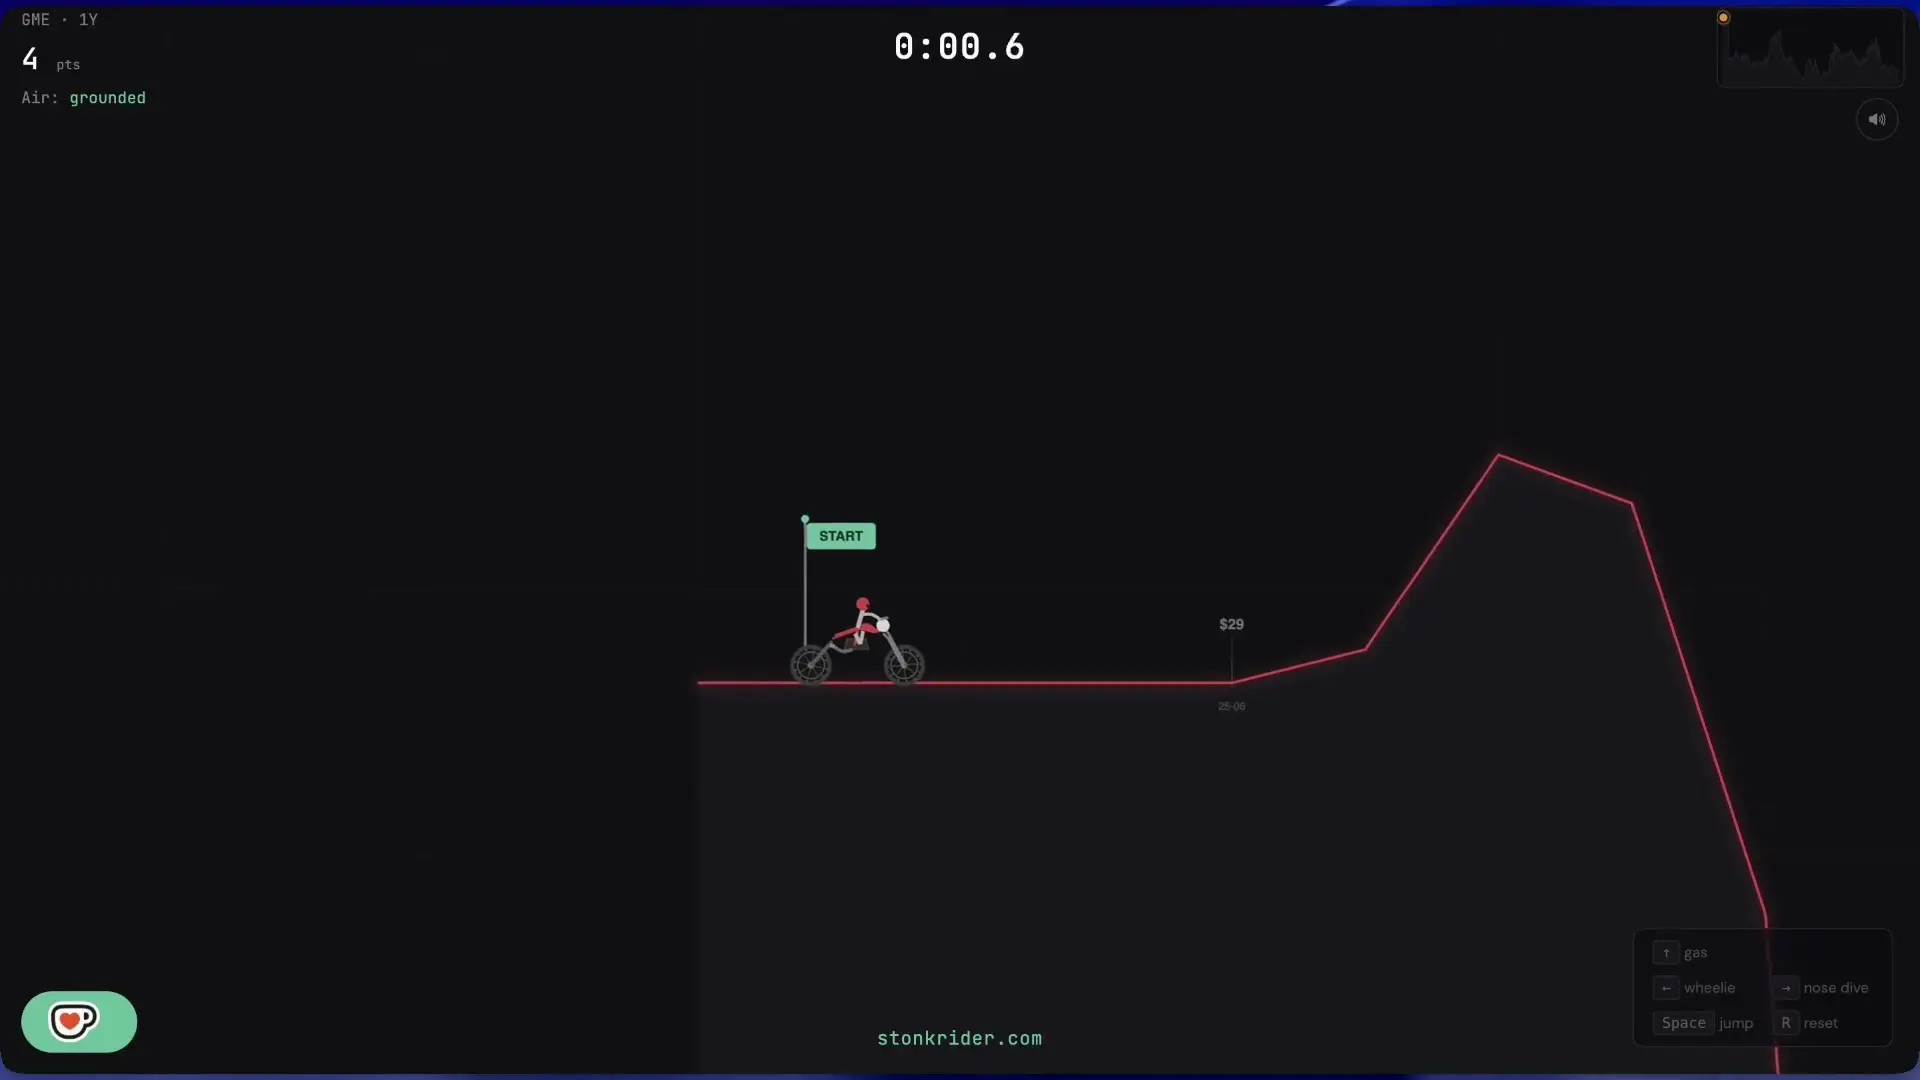
Steady, ascending bull runs turn into massive, momentum-building uphill climbs. Conversely, sudden market corrections and bear crashes transform into sheer, terrifying vertical drops and massive gaps where you have to nail the landing or wipe out entirely.
The Ultimate Irony: In the real financial world, a massive drop is a tragedy. In StonkRider, a devastating market crash is a sick ramp that gives you five seconds of airtime to pull off backflips.
Why It Works
What makes StonkRider stand out in the indie web-game scene is its blend of internet meme culture and genuine gameplay tension. The term “Stonk”—derived from the surreal internet meme mocking volatile retail trading—perfectly frames the game’s chaotic energy.
By tying the tracks to real-world financial assets, Dietrich created a built-in replayability loop. Players can test their driving skills on notoriously volatile charts like Bitcoin, Tesla, or historical economic crashes, turning abstract financial data into interactive, tangible obstacles.
It strips the stuffy, stressful nature out of Wall Street candlestick charts and replaces it with the simple, nostalgic joy of trying not to land a digital dirt bike on its head. If you have a few minutes to spare and want to see what riding a crypto crash feels like at 60 mph, StonkRider delivers exactly what it promises on the tin.